iStock.com/courtneyk
Post by James Ebdon[1]
At the start of the century UK government debt stood at 35 per cent of GDP[2]. Since then, it has tripled in two big steps during the financial crisis and the coronavirus pandemic to over 100 per cent. Alongside this expansion the public sector’s balance sheet has also become much more complicated for a variety of reasons:
- Financial assets and institutions brought onto the balance sheet as a result of interventions during the financial crisis;
- An increased willingness to intervene in novel ways and to take on more risk including from loans (both standard and convertible), equity stakes and guarantees;
- An enormous increase in the Bank of England’s balance sheet as it adopts new tools due to reaching the effective lower bound;
- A large increase, in recent years, in public investment increasing the stock of non-financial assets.
All these developments mean that both the level and the trajectory of public sector debt have become less useful tools to analyse fiscal sustainability and requiring the understanding of the broader balance sheet. They also mean that a greater emphasis needs to be put on the composition of the balance sheet. For a government holding significant financial assets net interest payments becomes more pertinent than gross. The exposure and sensitivity to both inflation and economic growth have also become more complex. And a better understanding of non-financial assets is needed to think through the consequences of climate change induced impairments
Statisticians from the UK’s Office for National Statistics have responded by developing wider outturn measures of all financial assets and liabilities (Public Sector Net Financial Liabilities) and wider still Public Sector Net Worth (PSNW)[3] which also includes non-financial assets. The Government has added these metrics to the suite of indicators it monitors[4] The Office for Budget Responsibility has also expanded the range of metrics it forecasts producing our Net Financial Liabilities since November 2016 and our first PSNW in October last year[5].
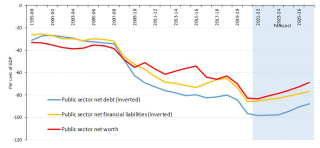
Historically we see that in the UK all measures of the balance sheet have deteriorated sharply this century. But Net Worth has declined least of all reflecting the build up of both financial and non-financial assets and the government’s efforts to limit the growth of its unfunded pension liabilities.
Figure 1 All measures of the UK balance sheet have deteriorated this century
But many of the things we are now forecasting (especially pensions, non-financial assets and some of the more exotic financial assets) are difficult to measure, forecast and interpret. Therefore, we will be paying more attention to the composition of PSNW and continue to refine our forecasting methods. As well as looking at the full balance sheet we can use our new tools to analyse and discuss the true impact of government policies whether long run pension reforms or the ‘fiscal illusions’ of asset sales.
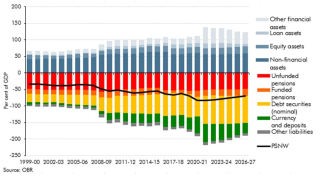
Under current policies we expect a reversal of the build up on both sides of the balance sheet over the medium-term, alongside an improvement in Net Worth. Much of this shrinkage will come from the Bank of England as it ends its main lending scheme and begins to run down its stocks of government debt. This shows up as a reduction in ‘currency and deposits’ liabilities and ‘other financial assets’ as seen in figure 2 below.
Figure 2: The composition of the UK balance sheet
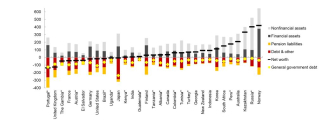
Looking at the full balance sheet is proving to be a useful tool in the UK and is likely to be even more interesting and informative for others. This is particularly the case for those countries with large natural resource reserves or financial investments whose long-term value is a key driver of fiscal sustainability.
Figure 3 International comparisons of net worth
[1] James Ebdon is the Team Leader for Fiscal Risks and Sustainability at the Office for Budget Responsibility in the United Kingdom
[2] General Government Gross Debt on a financial year basis.
[3] Wider measures of the public sector balance sheet: public sector net worth, Office for National Statistics, June 2021
[4] Charter for budget responsibility: autumn 2021 update, HM Treasury, October 2021
[5] Working paper No. 16, Forecasting the balance sheet: public sector net worth, Office for Budget Responsibility, October 2021
Note: The posts on the IMF PFM Blog should not be reported as representing the views of the IMF. The views expressed are those of the authors and do not necessarily represent those of the IMF or IMF policy.


