Posted by Elizabeth Gavin[1]
The IMF has recently published an analysis of aggregated data collected in the first International Survey on Revenue Administration (ISORA) from 135 tax administrations worldwide. This is the largest survey of tax administration to date. The IMF works with partners - CIAT, IOTA, and the OECD - to collect data through an on-line tool that participating countries use to report data.
ISORA accommodates the largest and smallest tax administrations in the world, to facilitate reasonable cross-country comparisons. These 135 tax administrations collectively represent economies making up 92 percent of world GDP, engage with more than a tenth of the world’s population as personal income tax payers, have an operating budget of over US $100 billion and conduct 50 million audits in a year.
The survey reveals considerable variation amongst tax administration. For instance:
- The five largest tax administrations employ an average of 226,000 staff, while the five smallest average 30 staff members.
- The five tax administrations that are best resourced in terms of staffing (measured in full-time-equivalents – FTEs) relative to population size serve 637 citizens per FTE on average, while the five that are least resourced in terms of this measure serve an average of 44,000 citizens per FTE.
- The figures for the number of registered active taxpayers per FTE also show a wide range: the average number of active taxpayers per FTE for the ‘top’ and ‘bottom’ five are 2,500 and 8 respectively.
The analysis in Understanding Revenue Administration categorizes the tax administrations into three groups, reflecting size and income level, as follows:
The analysis in Understanding Revenue Analysis focuses on: performance-related data, profile data, and data on operational and administrative practices. Some key findings based on profile data that tax administrations provided are highlighted below.
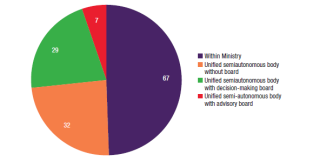
Institutional arrangements: Half the ISORA 2016 participants describe themselves as semi-autonomous bodies, with or without a board (Figure 1). However, almost three-quarters of the tax administrations in small states operate within Ministries. Eighty percent of co-managed customs and tax administrations operate as semi-autonomous bodies.
Figure 1 Institutional Arrangements Including Nature of Management Board (2015) - (Click on the figure for a better image quality)
Nature of revenue collected: Tax administrations collect many other taxes and non-tax revenue in addition to core taxes (personal income tax (PIT), corporate income tax (CIT), VAT, and social security contributions):
- 66 percent of participants collect domestic excise taxes;
- 40 percent collect motor vehicle taxes;
- 46 percent are involved in real property taxes collection;
- 22 percent collect wealth taxes;
- 37 percent collect estate, inheritance, and gift taxes.
- 59 percent report collecting at least one other tax in addition to those listed above.
Noncore taxes, social security contributions, and nontax revenues account for close to 40 percent of all revenues for small state jurisdictions, and about 30 percent for the others.
Staff profile of tax administrations – age and gender: Almost a quarter of employees in tax administrations in the higher-income group are aged 55 and over. The comparable figures for small-state and lower-income participants are 13 percent and 10 percent, respectively. On average, female staff make up 53 percent of tax administration employees, but only 40 percent of executives. The proportion of female staff and female executive staff is generally lower in lower income countries, averaging 38 and 32 percent respectively.
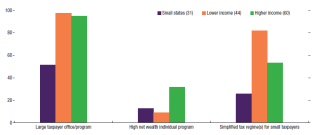
Approaches to specific taxpayer groups: Well above 90 percent of participants in lower-income and higher-income jurisdictions report having dedicated large taxpayer offices or programs. These programs vary considerably in respect of scope and full-time-equivalent to taxpayer ratios. Fewer tax administrations had a program dedicated to High Net Wealth Individuals (HNWIs). Tax administrations in small states are less likely to have programs for specific taxpayer groups (Figure 2).
Figure 2: Percentage of tax administrations with programs for specific taxpayer groups (2015) - (Click on the figure for a better image quality)
Compliance focal areas: VAT fraud is a high priority for 70 percent of ISORA’s participants. Lower-income jurisdictions also focus on preferential tax regimes and incentives, while for higher-income jurisdictions, base erosion and profit shifting (BEPS), aggressive domestic tax avoidance schemes and the underground or cash economy were identified as high priority focus areas.
Online tax return filing and payment: Not all tax administrations provided complete statistics on the filing and payment channels that taxpayers use, but from data supplied, the online filing rates are much higher for CIT and VAT than for PIT. Half of the payments for CIT, VAT and PIT are made electronically, according to tax administrations that provided detailed data. Unsurprisingly, online filing and payment rates are highest in higher-income countries.
ISORA 2016 data is available from the ISORA portal at https://data.rafit.org. Data from ISORA 2018, the survey currently underway covering over 150 administrations, will become available during 2019.
[1] Senior Economist, Fiscal Affairs Department, IMF.
Note: The posts on the IMF PFM Blog should not be reported as representing the views of the IMF. The views expressed are those of the authors and do not necessarily represent those of the IMF or IMF policy.


