Posted by Sanjay Vani
It is relatively easy to spot the trajectory of Public Financial Management (PFM) progress in any given country but how do we get a sense of the global trend during the last decade? A very useful and reliable source of information is provided by the World Bank’s Country Policy and Institutional Assessment (CPIA)[1] database. CPIA data offers a more complete source of comparative information than Public Expenditure and Financial Accountability (PEFA) assessments, data on which began to be collected only in 2005.
The CPIA exercise is conducted annually for all the Bank’s borrowing countries. It has evolved into a set of criteria which are grouped in four clusters: (a) economic management; (b) structural policies; (c) policies for social inclusion and equity; and (d) public sector management and institutions. Ratings for each of the criteria focus on the quality of each country’s current policies and institutions. CPIA is the only measurement tool that provides an annual numerical rating for the quality of PFM and other aspects. The annual CPIA exercise is informed by various available diagnostics including PEFA assessments and, as such, provides a good basis for analyzing trends in PFM.
Question 13 of the CPIA criteria[2] exclusively deals with the PFM aspects. It has 3 sub-questions which relate to:
(a) comprehensive and credible budget linked to policy priorities;
(b) effective financial management systems to ensure that the budget is implemented as intended in a controlled and predictable way; and
(c) timely and accurate accounting and fiscal reporting, including timely audit of public accounts and effective arrangements for follow up such as public access to budget documents and audit reports.
Countries are rated on their current level of performance in relation to the criteria, and not the degree of improvement since last year. Moreover, ratings are based on actual policies and performance, not on promises or intentions. Countries are rated on a scale of 1 (low) to 6 (high).
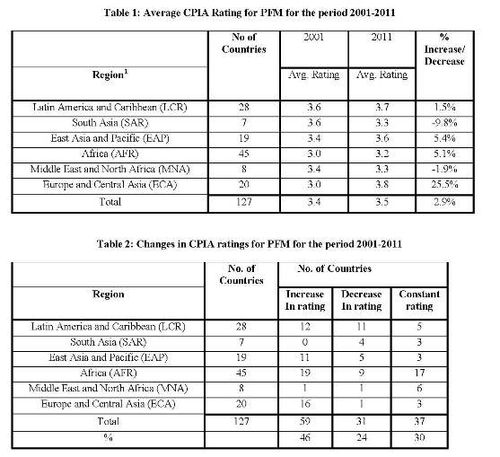
Since we know that PFM reforms take a long time to implement, a 10-year period should provide a sufficient window for the results of PFM reforms to show up in the CPIA ratings. The results of the analysis of CPIA data for 127 countries for the period 2001 to 2011 are shown in Tables 1 and 2.

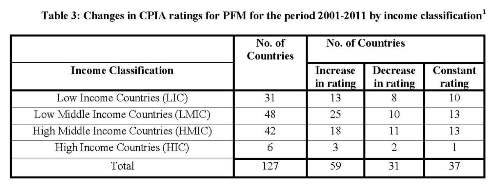
The same data can be used to analyze the correlation between income levels and PFM progress in a country - the results are shown in Table 3.

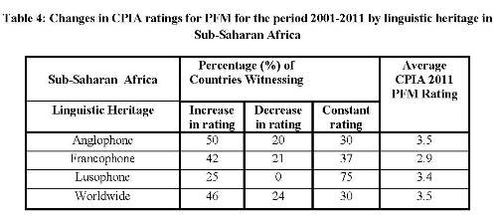
Analysis of the data for Sub-Saharan Africa to discern correlation between linguistic heritage and PFM progress is shown in Table 4.

An analysis of these tables indicates that:
- Globally, PFM is improving albeit slowly – the average CPIA rating for PFM increased from 3.4 to 3.5 over the period 2001-11 (Table 1).
- The ECA region stands out as the region with the largest improvement in PFM as well as the highest average rating for PFM in 2011 (Table 1).
- The AFR and EAP regions have also witnessed modest improvements in PFM (Table 1).
- The LCR region has almost the same number of countries witnessing an increase in their PFM rating as those witnessing a decrease (Table 1).
- The SAR region has experienced overall a significant deterioration in PFM ratings (Table 1).
- Overall, roughly about 50% of the countries have witnessed an improvement in PFM; about 25% of the countries have seen PFM deteriorating; while in about 25% of the countries there has been no change (Table 2).
- Out of 59 countries with improved PFM scores, 20 countries saw a change in their rating of +1.0 or more indicating substantial improvement in PFM, while 9 countries out of 31 saw a reduction in their PFM rating of -1.0 or more indicating a substantial deterioration (Table 2).
- The fact that changes in PFM occur in both directions indicates that PFM reforms/progress are not static and that PFM improvements can be reversed (Table 2).
- There is no discernable correlation between a country’s income level and the change in its PFM rating (Table 3).
- In Sub-Saharan Africa, the average CPIA rating for Francophone countries is lower than both the average rating for Anglophone countries and the worldwide average (Table 4).
It should be noted that the sample size for some of the regions is quite small, and that the results presented may not always be statistically significant. Moreover, the absence of substantial change in PFM performance at the aggregate level does not necessarily mean the absence of change in specific components such as budget preparation, budget execution, accounting and financial reporting. Nevertheless, a clear conclusion is that overall progress in improving PFM in the first decade of the 21st century has been slow and there remains a big agenda for PFM reforms globally.
[1] In September 2004, the World Bank’s Board of Executive Directors approved the disclosure of the numerical CPIA scores for IDA-eligible countries, starting with the results of the 2005 exercise. The scores of IBRD countries are not disclosed and are used for Bank’s internal purposes only. In view of this confidentiality, the article does not identify countries.
[2] There have been technical changes in the CPIA criteria for PFM during 2001-2011, but key aspects of the methodology remain the same.
[3] Regional groupings follow the World Bank’s definition of regions.
[4] The income classifications are based on estimates of gross national income (GNI) per capita (FY11).
Note: The posts on the IMF PFM Blog should not be reported as representing the views of the IMF. The views expressed are those of the authors and do not necessarily represent those of the IMF or IMF policy.


