
Credit PEFA/brijith Vijayan/iStock
Credit PEFA/brijith Vijayan/iStock
Credit PEFA/brijith Vijayan/iStock
Credit PEFA/brijith Vijayan/iStock
This blog is an update to an earlier blog published in 2023, which asked the question whether PEFA scores over the last two decades show an improvement or a decline in overall PFM performance. The previous blog post answered, yes, average PFM performance has improved moderately and there are opportunities for further accelerating the pace of reforms. In this updated post, which is based on expanded coverage of publicly available PEFA scores for 2005-2024, we find that the answer remains valid.
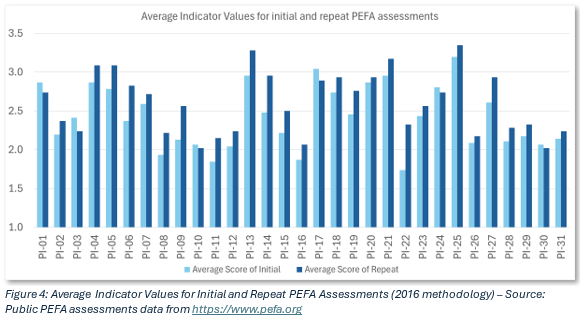
In analyzing the trends, average scores for 312 published national level assessments conducted with current and previous PEFA framework methodologies were used. PEFA Scores range from 1 to 4 (D to A in the methodology). A score of 2 reflects the basic level of performance for each indicator and dimension, aligning with good international practices. For analysis on the change in indicator scores for successive PEFA assessments, the ones based on the current PEFA methodology were used (46 assessments – 23 initial and 23 repeats).
It should be noted that these last six years of data should be viewed with extra caution. In particular, the period included the COVID-19 pandemic whose influence on PEFA results during the period 2019-2023 is not well understood.
Figures 1-5 below present some results of this analysis.
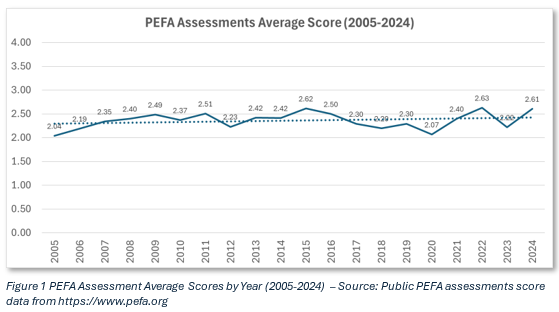
Some conclusions are as follows:
Overall average PEFA scores increased moderately during the period 2005 to 2024 (Figure 1).
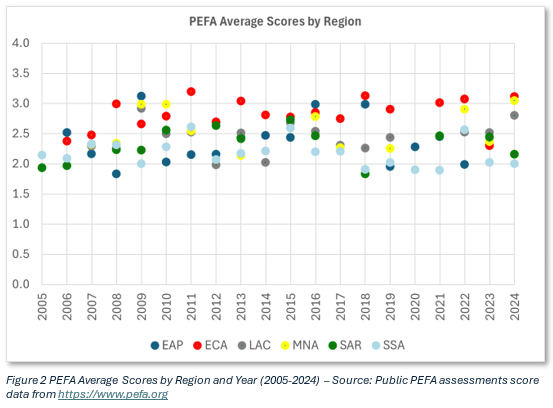
Average scores vary substantially by region, from 2.2 for Sub-Saharan Africa (SSA) and East Asia and the Pacific (EAP) to 2.8 (close to good performance) for Europe and Central Asia (ECA). Middle East and North Africa (MNA) and Latin America and the Caribbean (LAC) follow closely with average scores in the 2.5-2.6 range, while the rest are in the 2.2-2.3 range. The gap between the best and the worst performing regions remains largely unchanged. (Figure 2)
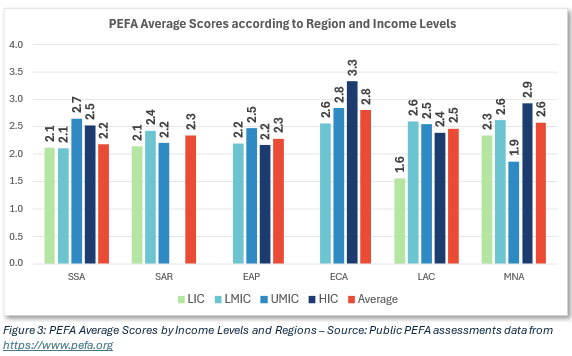
High-Income and upper middle-Income countries[1] continue to demonstrate better performance across regions. Low-income and lower middle-income countries have an average score of 2.1 and 2.3 respectively, with ECA showing better than the average score in most income classifications. (Figure 3)
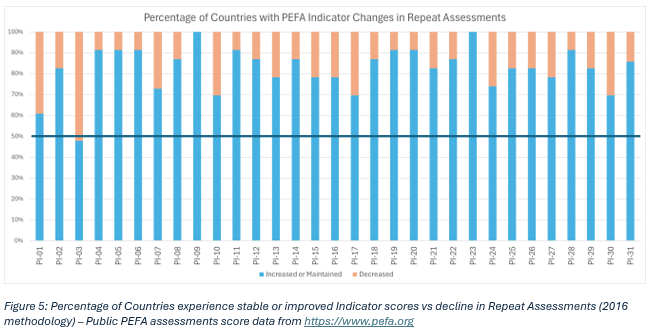
Furthermore, for repeat assessments, going beyond averages, for 30 out of 31 indicators, there have been more cases of scores improving or remaining unchanged compared to number of indicators that saw deterioration. (Figure 5)
Key messages:
Average scores for PEFA assessments increased moderately throughout 2005 – 2024, but the overall progress has been slow and variations across regions and countries continue.
A significant portion of evaluations done using 2016 methodology have been repeat assessments, which focus on whether performance has improved since the previous assessment and potential areas for further development. PFM systems, when seen at indicator level, show more progress or stability in scores when compared to cases of backsliding. Countries that have not yet undertaken such repeat assessments may consider doing so.
Researchers should be encouraged to conduct more detailed analysis of the substantial and expanding volume of data on PFM performance. These data can be accessed on the Assessments Portal of the PEFA webpage ( https://www.pefa.org ).
[1] World Bank Country Income classification definitions and details can be found at https://datahelpdesk.worldbank.org/knowledgebase/articles/906519-world-bank-country-and-lending-groups


