
Credit PEFA/brijith vijayan/iStock by Getty Images
Credit PEFA/brijith vijayan/iStock by Getty Images
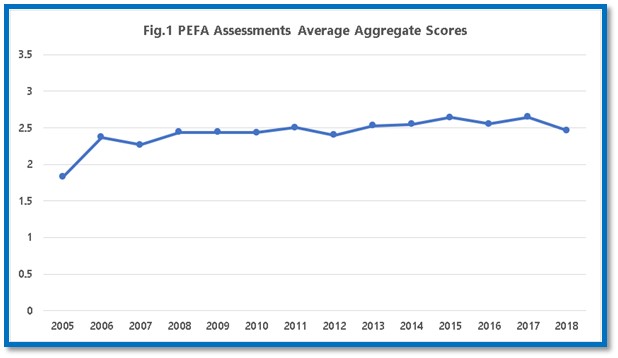
Average PEFA scores increased moderately during the period 2005-2018.
Credit PEFA/brijith vijayan/iStock by Getty Images
Credit PEFA/brijith vijayan/iStock by Getty Images
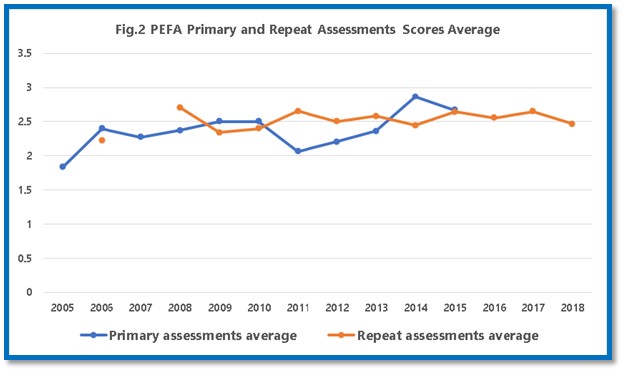
Average PEFA scores increased moderately during the period 2005-2018.
A question frequently asked by researchers and experts is whether PEFA scores over the last two decades show an improvement or a decline in overall PFM performance. The simple answer to the question, is yes, average PFM performance has improved moderately and there are opportunities for further accelerating the pace of reforms.
There are plenty of data to reflect upon. Since 2005, 365 national PEFA reports have been finalized and 284 are already published on the PEFA Website. The scores of PEFA assessments attract the attention of reserachers and experts, raising the question of how to interpret these data and trends. In this article we present some preliminary findings that may be of interest to policy makers, practitioners and researchers.
This blog specifically looks at data from 2005-2018 to reflect on past trends. In analyzing the tends in average PEFA scores over the period 2005-2018, the 2011 PEFA methodology has been used. 315 national PEFA assessments were completed during this period. Scores range from 1 to 4 . A score of 2 reflects the basic level of performance for each indicator and dimension, consistent with good international practices.
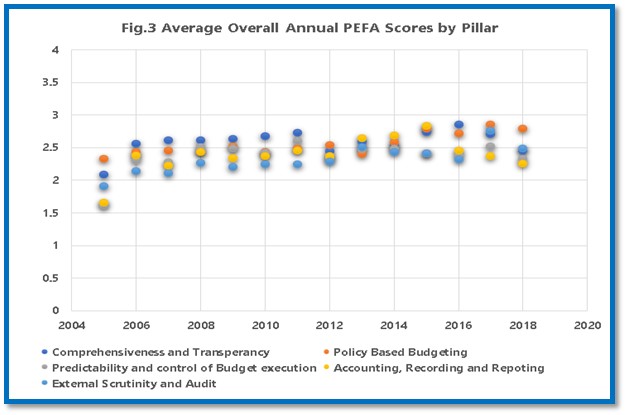
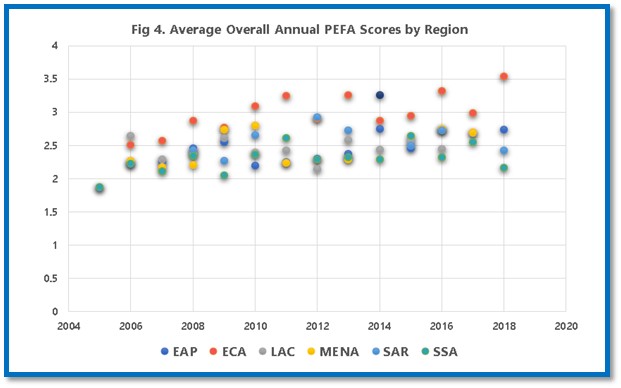
Figures 1-5 below present some results of this analysis.
Some conclusions are as follows:
Some countries have shown a substantially better performance than the general trend, with improvements of up to 0.5 points in their average PEFA scores since the mid-2000s. These improvements are noticed across all regions.
Key messages:
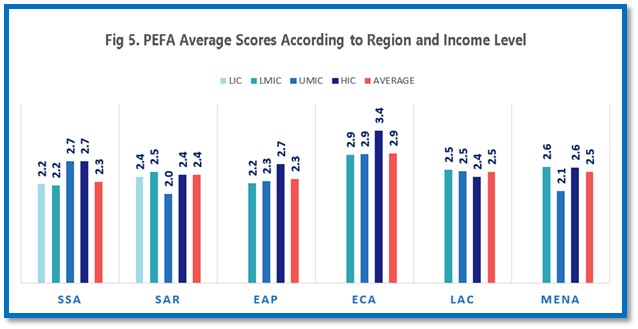
[1] Economies are divided among income groups according to 2018 gross national income (GNI) per capita, calculated using the World Bank Atlas method. The groups are as follows: low income, US$1,005 or less; lower middle income, US$1,005-3,956; upper middle income, US$3,956–12,235; and high income, US$12,236 or more.


