The Jamaican government has been breaking new ground on analyzing the country’s fiscal risk exposure and quantifying the potential long-term risks from climate change, using some of the latest available methods and tools.[1] Jamaica is ahead of the curve when it comes to mapping its climate-related risks. J-SRAT (the Jamaica Systematic Risk Assessment Tool), currently under development, aims to bring together exposure hazard maps, identify climate risk hotspots, and estimate the impact of severe weather events on public infrastructure (including power, transport, and water).
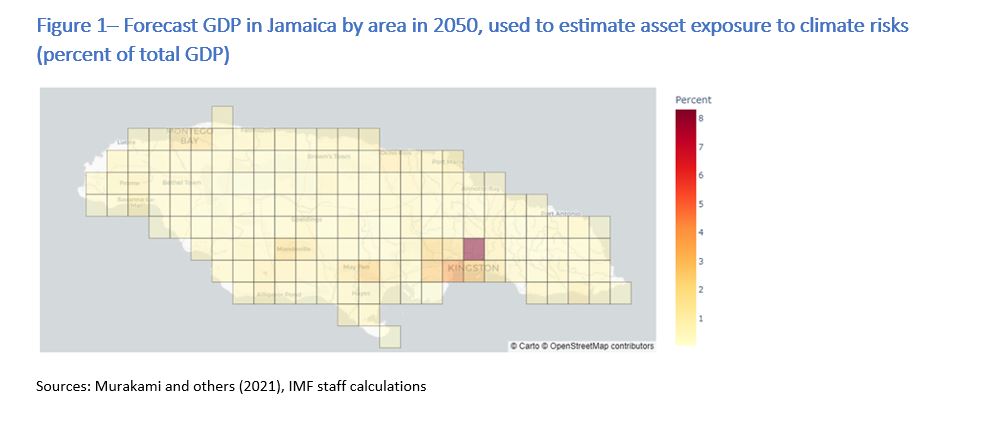
The work supported by the IMF was somewhat experimental, trialing innovative methods and techniques to put numbers on a country’s physical climate-related risks. A first approach outlined how to produce estimates of asset damages with data on maximum wind speed by location from the Jupiter Intelligence database[2], which approximates the position of physical assets using gridded GDP[3], and regional vulnerability curves (Figure 1). Among 90 countries exposed to hurricanes analyzed with this approach, Jamaica is in the highest 25 percent, with future damage rates averaging 1 percent of asset value per year.[4] These damage rates can be estimated for different future climate scenarios.

A second approach, to evaluate the impacts of a rise in sea levels, was also tested. Using data from Jamaica’s economy, coastal topography, exposed assets and exposed population, the costs of three scenarios were estimated:
- No planned adaptation – society reacts to sea-level rise by relocating after flooding occurs, no protection is built and capital losses from rising sea levels are large.
- Full protection – seawalls and other barriers to protect against a sea-level rise are constructed without relocating people or assets.
- Planned retreat – a sea-level-rise is anticipated through building new assets away from exposed coastlines and relocating people or assets over time.
The results of this exercise – which are subject to many assumptions and uncertainties - are as follows. The cost of the no-adaptation scenario was estimated at US$222 billion for the period to 2100[5]. For the full protection scenario, the total cost is US$68 billion, while the planned retreat scenario costs US$3 billion. The orders-of-magnitude differences between their costs give a clear signal to policymakers and should be consulted with citizens as part of expenditure prioritization.
Such analysis can help planners and policymakers when it comes to considering their spending options from climate change adaptation, and the budgetary implications. For example, development in more exposed areas can be curtailed or subjected to higher building standards. The analysis can also help inform decisions on how much to invest in adapting future infrastructure to be more climate resilient, how much to invest in retrofitting existing assets, and what level of residual risk to accept. Adaptation investments should be appraised together with all other government spending needs – there are still trade-offs involved. Existing cost-benefit approaches should be applied so that public spending policies can maximize the welfare of citizens over the coming decades.
Finally, FAD’s Quantified Climate Risk Analytical Fiscal Tool (Q-Craft) has helped the authorities estimate the long-term impacts of temperature rise on Jamaica’s economy and public finances. The results suggest that temperature increases by themselves will not have a large impact, and from mid-century will be outweighed by the fiscal costs of an aging and declining population.
The techniques and tools described above can be applied to most countries using global databases already prepared by IMF staff. However, country specific data is instrumental for improved calibration of the models used and sustaining ownership (buy-in) from the authorities. When country level data are unavailable, there is also potential to include other datasets to make the analysis more country specific. Examples include geolocation services, such as OpenStreetMap, to map asset locations more accurately, and national-level demographic and economic data to better incorporate the country-specific circumstances. Tracking historical data and costs from climate-related disasters is useful if modeling capacity is limited.
The tools used in Jamaica can be adjusted for various purposes, ranging from project selection and appraisal to climate stress testing. This is critical for effectively using the limited human resources available in host countries, for example in delivering the reform measures supported by the IMF’s Resilience and Sustainability Fund (RSF) or other development partners.
As the old adage says – “if you can’t measure it, you can’t manage it”. Together these methods can help to put numbers on potential climate-related risks – which is vital if countries are to develop evidence-based and cost-effective long-term policy responses to climate change.
[1] The work was supported by a recent IMF mission led by its Fiscal Affairs Department and including Lesley Fisher, John Grinyer, Mahmut Kutlukaya, Emanuele Massetti , Murray Petrie , and Javier Uruñuela López .
[2] The Jupiter Intelligence database provides projections for physical climate risks (from hurricanes, wind damage) at a high level of geographical resolution under different climate scenarios.
[3] Gridded GDP is a method to estimates the value of goods and services produced within a specific geographic area – for Jamaica a 7 km2 resolution was used. See Murakami et al 2021.
[4] Damage rates are defined as the expected loss in asset value per year from tropical cyclones under various climate scenarios (SSPs).
[5] This reflects the high cost of losing housing, buildings and other infrastructure to rising sea levels, and having to rebuild further inland.


