What is the state of your personal finances? You probably think first about your debts: your mortgage, your credit card balance, and your student loans. But you probably also think about how much cash is sitting in the bank, the value of your house, and the rest of your nest egg.

Posted by Vitor Gaspar, Jason Harris, and Alexander Tieman[1]
Surprisingly, most governments do not approach their finances this way.
Our research in the new Fiscal Monitor shows that few governments know how much they own, or how they use those assets for the public’s well-being. Knowing what a government owns and how they can put their assets to better use matters because they can earn about 3 percent of GDP more in revenues each year and reduce risks, all at once. That’s as much revenue as governments make from corporate income tax receipts in advanced economies. Governments can put this money toward better schools, hospitals, or other priority spending.
It’s what you own, not just what you owe
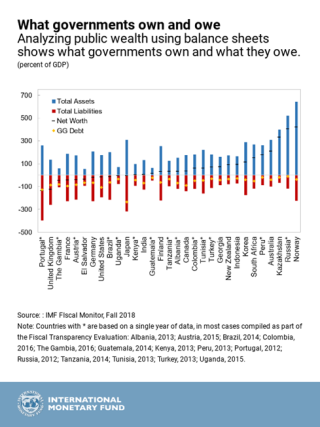
In the Fiscal Monitor we analyze public wealth using data from 31 countries. We show that their assets amount to $101 trillion, or 219 percent of GDP.
These assets consist of public infrastructure such as roads, bridges, and sewer pipes, as well as the money governments have in the bank, their financial investments, and payments owed to them by individuals and businesses.
Natural resource reserves in the ground are also part of assets, something that is particularly important for natural resource-rich countries. But assets also include state-owned enterprises such as public banks and, in many countries, utilities such as public electricity and water companies.
We also show that total liabilities are much larger than debt alone. They come to about 198 percent of GDP, less than half of which is general government public debt. Pension obligations to civil servants are a large part of the remainder, yet few countries record them as such.
Another part is debt owed by public corporations. Most standard measures of general government debt do not include this, meaning that significant amounts of public debt are classified as private debt.
Emerging markets’ debts and assets
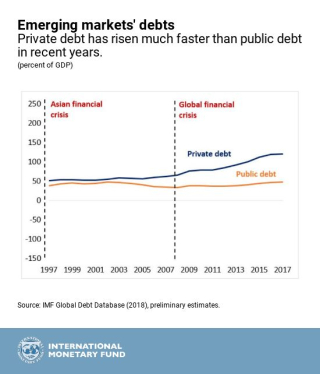
In emerging market economies private debt has risen much faster than public debt, as shown in the chart below. Take China, for example. Total debt is 247 percent of GDP. But the dividing line between what is public and private debt in China is blurry. This blurriness reflects the very large number of public units and corporations, the complex layers of government, and widespread subnational off-budget borrowing.
As a result, estimates of 2017 public debt vary considerably: the official government debt figure is 37 percent of GDP, while the data reported in the latest World Economic Outlook show it at 47 percent of GDP, and the ‘augmented’ debt measure, which includes more off-budget borrowing by local governments, stands at 68 percent of GDP. As China works to compile a full general government balance sheet, this picture will come into clearer focus.
So, how resilient is China’s government balance sheet?
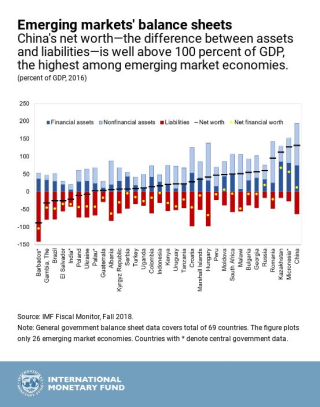
China has substantial government assets, reflecting years of high infrastructure investment. These assets are larger than its liabilities, putting net worth—the difference between assets and liabilities—well above 100 percent of GDP, the highest among emerging economies.
This is a significant buffer when compared to total debts of public corporations, particularly considering that public corporations also have assets. So, while debt-related risks in China are large, there are also buffers. Moreover, the government is taking steps to contain risks by reining in off-budget borrowing and strengthening oversight, resulting in a slowdown in the buildup of debt.
However, most of China’s government assets are nonfinancial, like buildings, roads, and railways. While they can generate revenues through fees and rents, they are not easily available to cover liquidity needs. Also, the valuation of these assets is surrounded by uncertainty. With no official estimates available, we use an estimate from our capital stock database. Net financial worth, which excludes these nonfinancial assets, is much smaller. It still positive and higher than the emerging market average, although it has declined in recent years, mainly due to developments at the subnational government level.
Improve resilience
More generally, our research illustrates that public sector assets could act as a buffer that allows governments with high public wealth to weather recessions better than those with low public wealth. Stronger balance sheets—a statement of what you owe and own at a given point in time—allow governments to boost spending in a downturn.
This cushions the impact of the shock and results in shorter and shallower recessions. Take Kazakhstan in 2014, when it faced a halving of oil prices and a slump in external demand. The government responded by using part of its financial assets in the National Fund to ease the downturn.
Doable for all
All governments can better manage their resources. They should start by bringing data together to come up with a rough estimate of public sector assets, liabilities, and wealth. Over time, better accounting and statistical collections can improve the accuracy of these estimates. Governments can use them to do basic balance sheet risk and policy analysis, using the framework presented in this report. Governments who are interested in compiling and analyzing their balance sheets should contact FAD for guidance and assistance.
Once this exercise is completed, governments will be able to show their citizens the full extent of what they own and owe, and better use public wealth to meet society’s economic and social goals.
[1] Vitor Gaspar is the Director of the Fiscal Affairs Deparment. Jason Harris and Alexander Tieman are Deputy Division Chiefs in the Department.
Note: The posts on the IMF PFM Blog should not be reported as representing the views of the IMF. The views expressed are those of the authors and do not necessarily represent those of the IMF or IMF policy.


