Posted by Jason Harris[1]
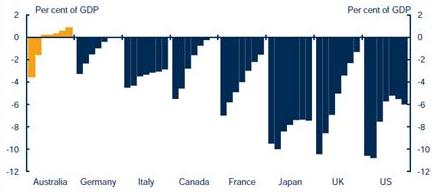
The latest Australian Budget, for the fiscal year beginning on July 1 was released last week amid much fanfare. As in the last couple of years, its focus was squarely on maintaining fiscal discipline, with the budget still on track to return to surplus in 2012 (Chart 1), net debt peaking at 7.2 percent of GDP and no new net spending decisions.
Chart 1: Budget Balance (2010 – 2016)

The budget in Australia is unusual, in that it provides detailed estimates of revenues and expenditure out over four years: both for the budget year (in this case 2011-12) and out over the three ‘forward estimate’ years, ending in 2014-15.
The government is able to make policy decisions that stretch out beyond the annual budget, with all of those decisions reflected in the fiscal aggregates. In this sense, it is one of the prime working examples of a medium-term budgetary framework, with other fine examples including Sweden, the UK, Netherlands, and Korea.
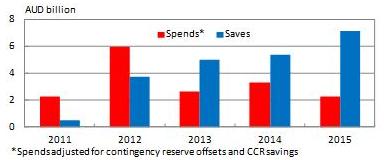
The benefits of this medium-term focus become clear when looking at the major policy decisions taken in the budget (Chart 2). Just over a third of all the spending decisions take place in the 2011-12 – the bulk of them occur in the later years. This allows for better design, phasing and implementation of new policies.
Chart 2: Policy Decisions by Year

Similarly the bulk of the savings occur over the forward estimates, with less than a quarter occurring in the budget year. While in some places the credibility the profile of these savings would be brought into question (it is always easy to promise savings in the future), under the Australian system, once announced in the budget, these medium-term savings are policy, and will continue to occur unless an explicit decision is taken to overturn them. Further, the budget system has a track record on delivering on such savings, building up a substantial degree of credibility.
So what shape do these policies take? Well, if this were an annual budget, there wouldn’t be much incentive to make some of these decisions. Two of the biggest savings have very small impacts in the first year, and only begin to hit their strides in the outyears:
• Tightening up of a fringe benefit tax for cars (tax expenditure): yielding $135m in the first year, increasing to $450m a year by 2014-15.
• Pausing indexation of upper payment limits on family payments – yielding $230m in the first year, up to $500m a year by the end of the forward estimates.
Similarly, some the major spends – like most key policies – take some time to come into force:
• A major regional school and hospital investment program begins only slowly, with $175m of spending in the first year, increasing to $508b by 2014-15.
• A mental health reform program begins only gradually, with $37m in the first year, increasing to $407 million by the 2014-15.
By adding the extra time dimension, the medium-term budget has two big advantages. First, it allows governments to undertake major reforms over a period of time, with all stakeholders understanding what the new policies involve, and how much funding will be available. Second, it reveals the full costs/savings of policy changes out over the medium term, information that may not be provided, or even be assessed under annual budgeting.
In this budget all new policy spends were offset by savings decisions over the medium term. Over the forward estimates, the overall impact of new spending and savings decisions was a net saving of AUD5.2 billion. But close watchers of the Australian budget will notice that the budget deficit in this budget is larger than previously announced (deficits of $49 b in 2010-11 and $23b in 2011-12 compared to $41b and $12b in the mid year update).
How does that square with all of those savings? The answer to that is a set of negative parameter variations (i.e. changes unrelated to any government policy decision), both on the spending and revenue side. First, and most prominently, much of the spending variations related to the natural disasters that beset Australia this year (mainly flooding), which also reduced revenue collections. Second is the impact of lower tax collections, largely owing to the exchange rate appreciation, and an upward reevaluation of capital gains tax losses during the financial crisis, both of which depress revenue receipts. The downward revision to parameters reflects a turnaround to the past few years, where the impact of the terms of trade boom resulted in upward revenue revisions.
Finally, the response to the natural disaster outlined in the budget also provides a nice example of how medium-term budgeting can allow a country to spend significant amounts immediately in response to natural disasters, while spreading offsetting savings out over a longer period, to leave a net neutral impact on the budget balances.
Other highlights in the budget include:
The glossy, for a brief overview of the budget.
The fiscal outlook, including the fiscal strategy, how it has been met and the analysis underpinning it, including sensitivity analysis.
The revenue statement, providing in depth analysis around the revenue forecasts, how they have changed and the underpinning relationships between revenues and economic parameters.
The fiscal risk statement (for an excellent example of a fiscal risk assessment).
The financial statements (for a good example of how accrual and cash budgeting interact).
[1] Jason Harris is a Technical Assistance Advisor at the IMF. Full disclosure: he previously worked in the Australian Treasury preparing the Commonwealth Budget, and as an economic and fiscal adviser to the Australian Prime Minister.
Note: The posts on the IMF PFM Blog should not be reported as representing the views of the IMF. The views expressed are those of the authors and do not necessarily represent those of the IMF or IMF policy.


